K-Means Algorithm
Clustering is a fundamental concept in machine learning, and one of the go-to algorithms for partitioning data into distinct groups is the K-Means algorithm.
Understanding the Basics:
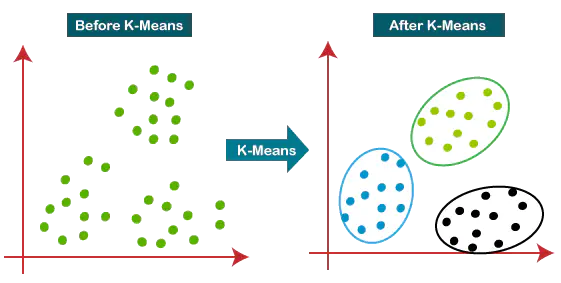
K-Means is a centroid-based clustering algorithm designed to partition a dataset into K clusters. The “K” in K-Means represents the predetermined number of clusters the algorithm aims to identify. It’s an unsupervised learning method, meaning it does not require labeled training data to function.
How It Works:
Initialization: K-Means begins by selecting K initial centroids, one for each cluster. These centroids can be randomly chosen data points or strategically placed based on some prior knowledge.
Assigning Data Points to Clusters: Each data point is assigned to the cluster whose centroid is closest to it. Proximity is typically measured using Euclidean distance, but other distance metrics can be employed based on the nature of the data.
Updating Centroids: After the initial assignments, the centroids are recalculated by taking the mean of all the data points within each cluster. This step iterates until the centroids no longer change significantly or a predetermined number of iterations is reached.
Convergence: The algorithm converges when the centroids stabilize, and the assignments remain unchanged between iterations.
# This is a K-Means algorithm implemented from scratch
# It initializes k random centroids and assigns points to clusters using euclidean distance
# With each iteration, centroids are recaluclated based on the mean of data points assigned to that cluster
# If a smaller euclidean distance to another centroid is identified, the data point is reassigned to the other cluster
# The algorithm will converge when centroids become statatic or after 100 iterations, whichever happens first

# Arguments: k is predetermined number of clusters; X is input data
# Returns: centroids are values of cluster centersl labels are cluster assignments for each data point

import numpy as np
import pandas as pd

def KMeansFromScratch(k, X):
  centroids = X[np.random.choice(range(X.shape[0]), k, replace=False)]
  for i in range(100):
    prev_centroids = centroids
    distances = np.concatenate([np.linalg.norm(X - centroid, axis=1).reshape(-1, 1) for centroid in centroids],axis=1)
    labels = np.argmin(distances, axis=1)
    centroids = pd.DataFrame(np.concatenate([X, labels.reshape(-1, 1)], axis=1)).groupby(2).mean().values
    if np.array_equal(centroids, prev_centroids):
      return centroids, labels
  return centroids, labels
Applications of K-Means:
Image Compression: K-Means can be used to reduce the number of colors in an image, effectively compressing it while preserving its essential features.
Customer Segmentation: Businesses utilize K-Means to categorize customers based on purchasing behavior, allowing for targeted marketing strategies.
Anomaly Detection: K-Means can identify outliers or anomalies in datasets by grouping normal data points into clusters and isolating those that deviate.
Genetic Clustering: In biological research, K-Means helps classify genes with similar expression patterns, aiding in the identification of gene functions.
Challenges and Considerations:
Sensitivity to Centroid Initialization: K-Means results can vary based on the initial placement of centroids, and multiple runs with different initializations may be needed to find the optimal solution.
Assumption of Spherical Clusters: The algorithm assumes that clusters are spherical and equally sized, which may not be suitable for all types of data.
Possibility of Empty Clusters: As the algorithm iterates to convergence, there is a chance that all data points get reassigned from a cluster, leaving it empty. A common solution is to choose a random point to act as a new centroid if any empty clusters are detected.
# This is a comprehensive K-Means Algorithm using the sklearn package
# Outliers are identified using isolation forest and removed
# Model fit is evaluated using normalized mutual information by comparing predicted labels to ground truth labels
# Ten runs of K-Means are completed and the model with the highest NMI score is selected

# Arguments: k is predetermined number of clusters; X is input data; true_labels are ground truth labels
# Returns: final_centroids are values of cluster centers; final_labels are cluster assignments for each data point

from sklearn.cluster import KMeans
from sklearn.ensemble import IsolationForest
from sklearn.metrics import normalized_mutual_info_score
import numpy as np

def ComprehensiveKMeans(k, X, true_labels)
  isolation_forest = IsolationForest()
  isolation_forest.fit(X)
  outliers = isolation_forest.predict(X)
  X = X[outliers == 1]

  kmeans = KMeans(n_clusters=k)
  best_score = -1
  best_model = None

  for i in range(10):
    kmeans.fit(X)
    labels = kmeans.predict(X)
    score = normalized_mutual_info_score(labels, true_labels)

    if score > best_score:
      best_score = score
      best_model = kmeans

  final_labels = best_model.predict(X)
  final_centroids = best_model.cluster_centers_
  return final_centroids, final_labels
Max Melnikas
Master of Science Candidate
My research interests include applications of digital devices for cognitive health monitoring and research matter.